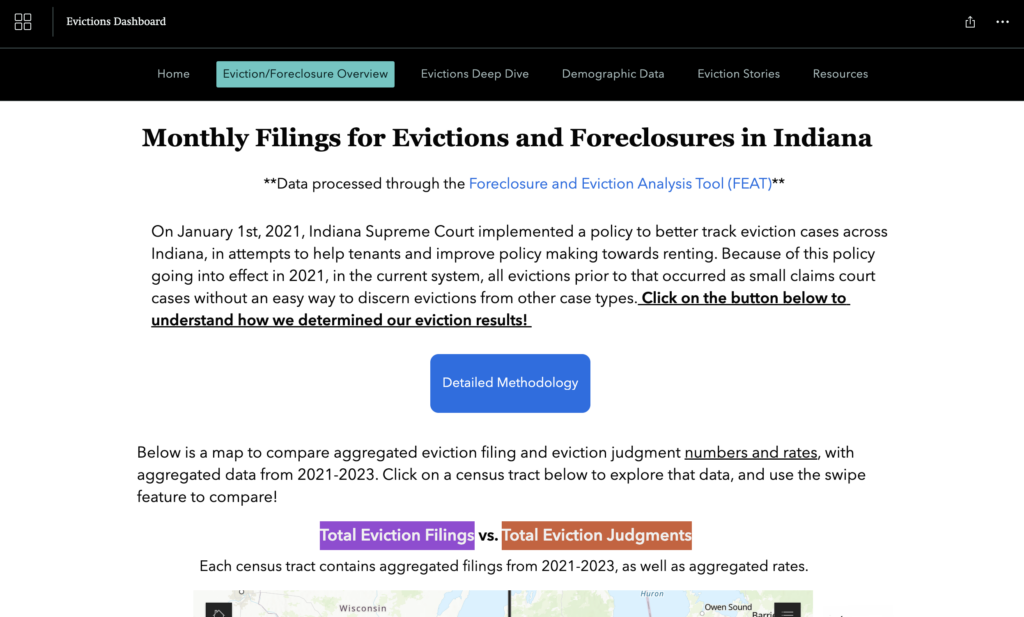
The state of Indiana has recently released an Eviction Dashboard, an interactive website that features data on eviction filings, mapped to geographic and demographic data.
The Evictions Dashboard includes graphics, maps, and charts of things including:
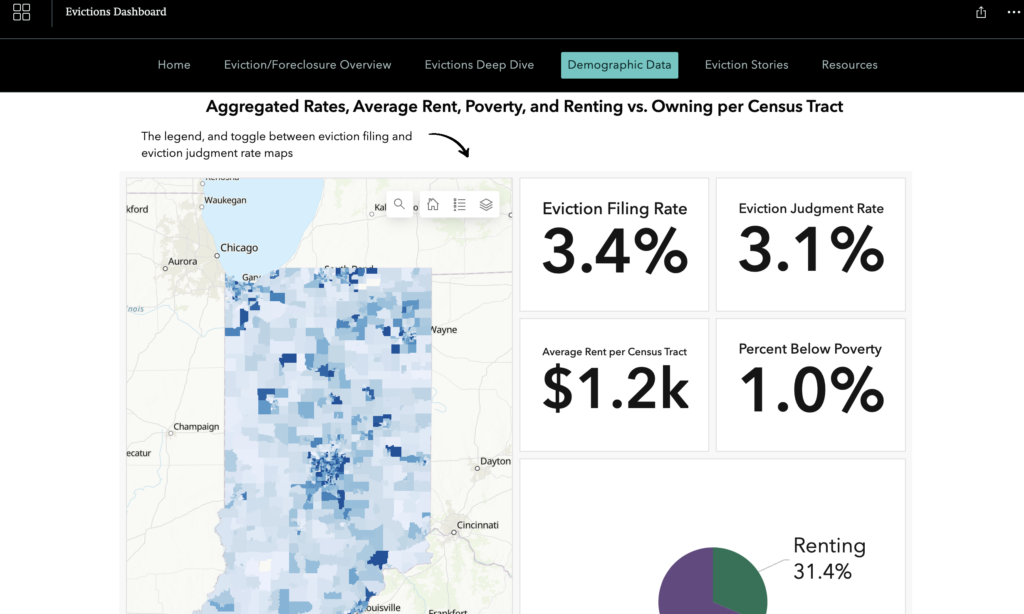
- how many court filings there are for evictions and for foreclosures
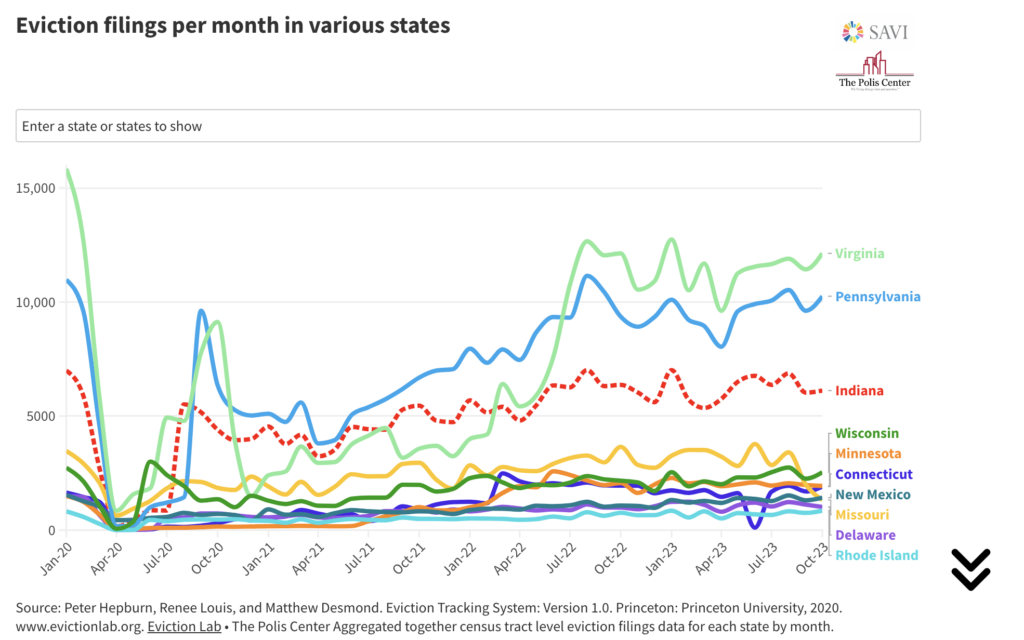
- how Indiana’s filing rates compare to other states
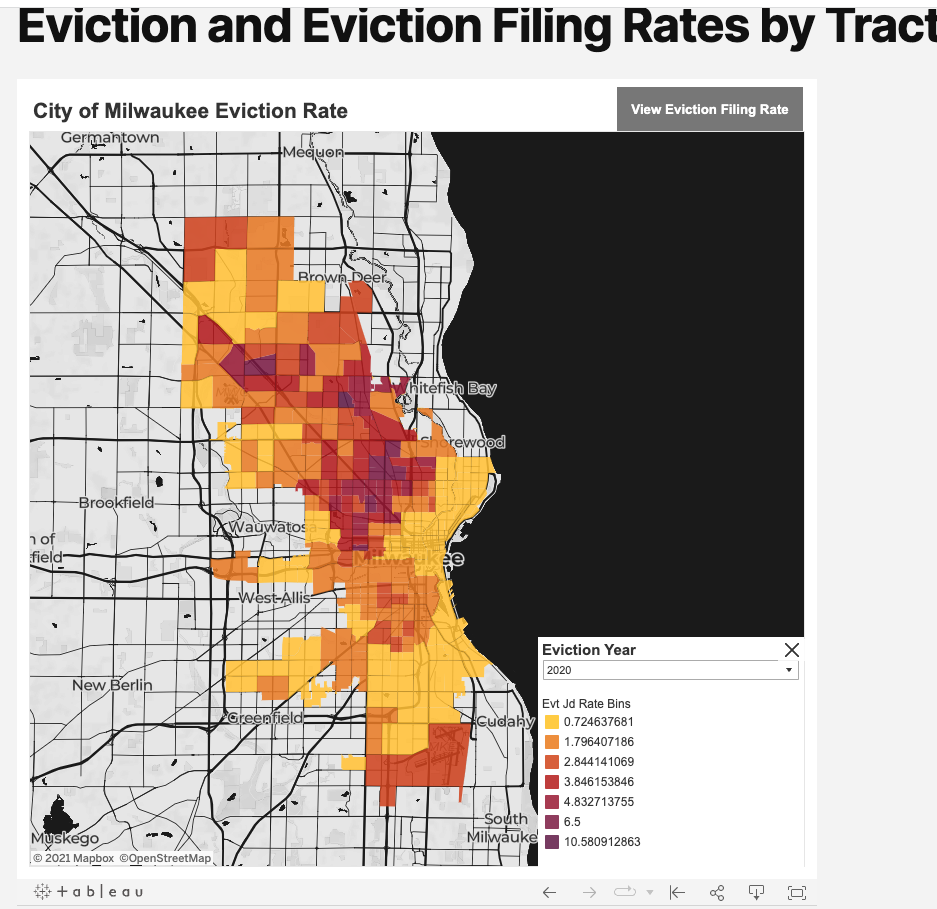
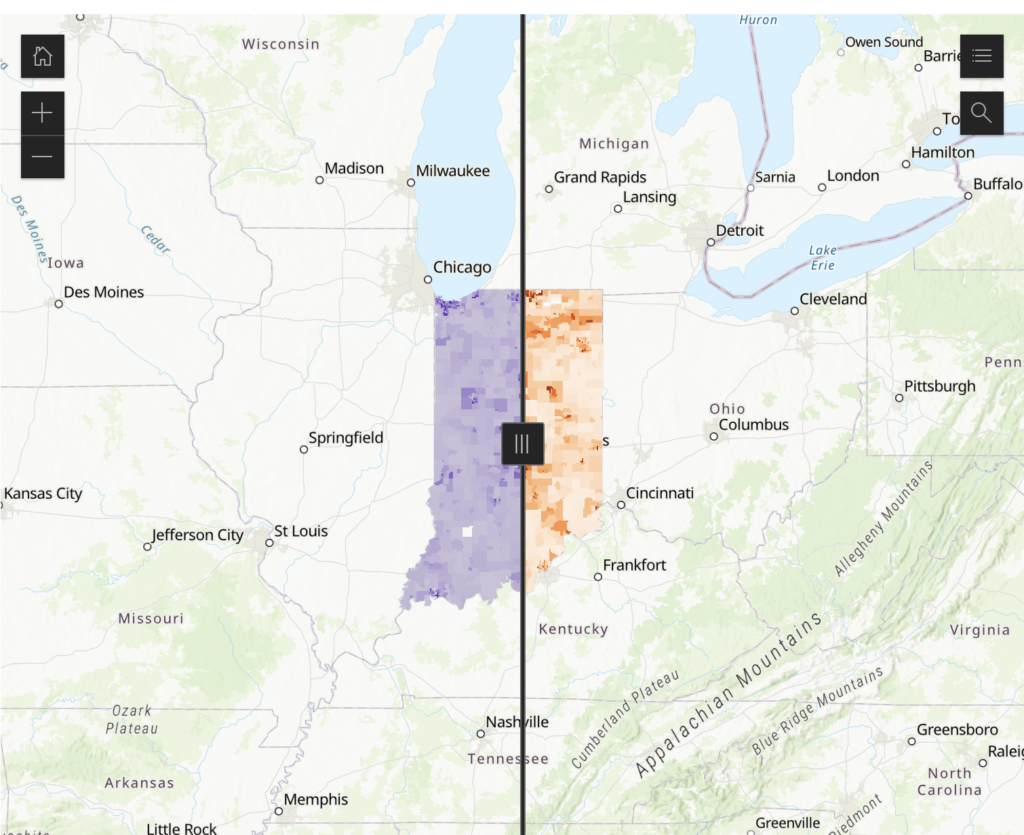
- where the court filings are happening, in different census tracts in the state
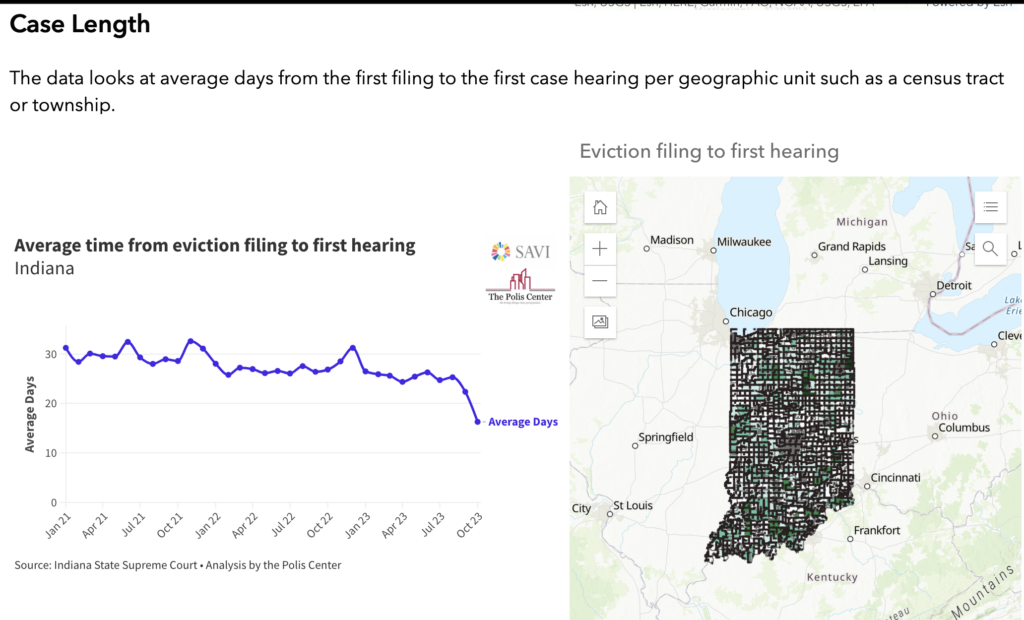
- how long the case take, from filing to resolution
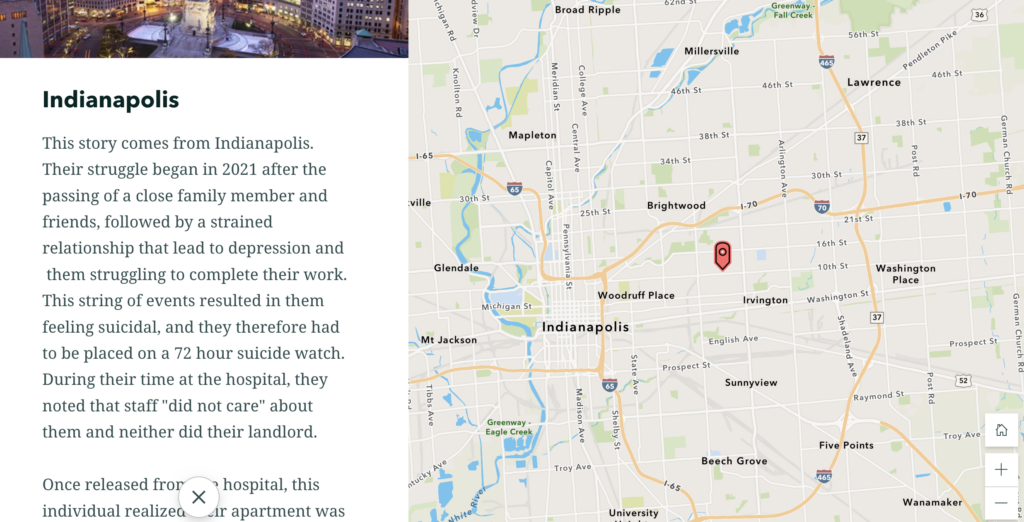
- real stories from people who go through an eviction in these different places
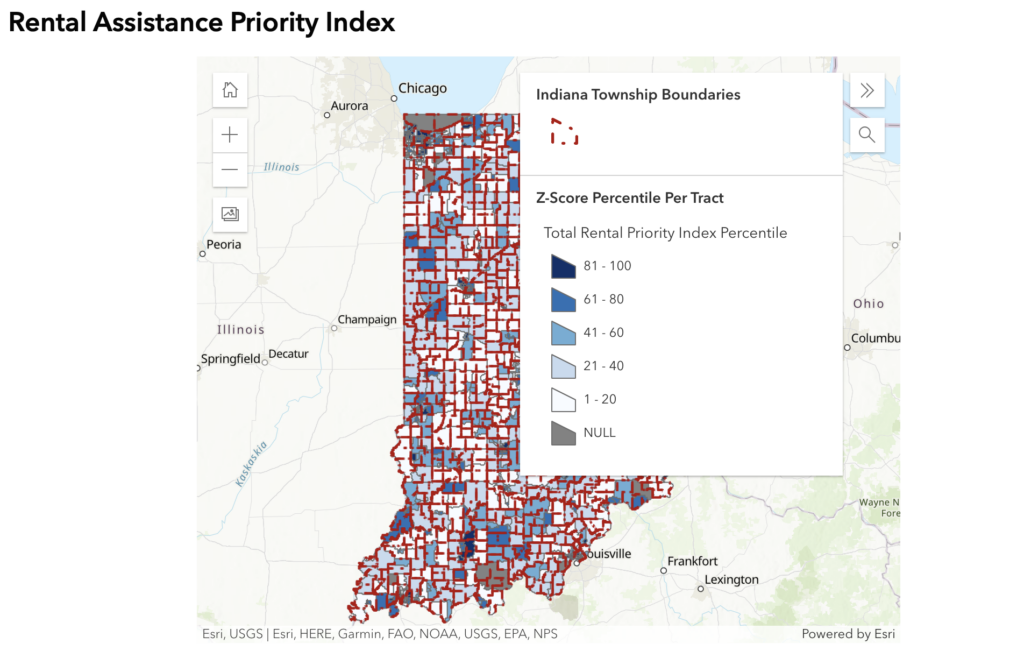
- profiles of different census areas’ housing, poverty, rent assistance, and demographic groups
It has been built by groups including the Polis Center at Indiana University.
See more about how it’s been built at the Methods section, summarized here:
The data presented is a compilation of court case records obtained directly from the Indiana Supreme Court, filtered and aggregated by the Polis Center (see the Methods FAQ for more details), as well as data obtained through the Foreclosure and Eviction Analysis Tool (FEAT). This dashboard is a representation of both quantitative and qualitative data surrounding the eviction and foreclosure realm, with a goal of providing transparent and open access to data. It has been designed to be used by many different stakeholders including tenants themselves.
https://storymaps.arcgis.com/collections/cb395c1ffe0a454d84c530a797aa0201?item=1