The Stanford Legal Design Lab & the National League of Cities has a new interactive worksheet to help you use data to profile your eviction landscape.
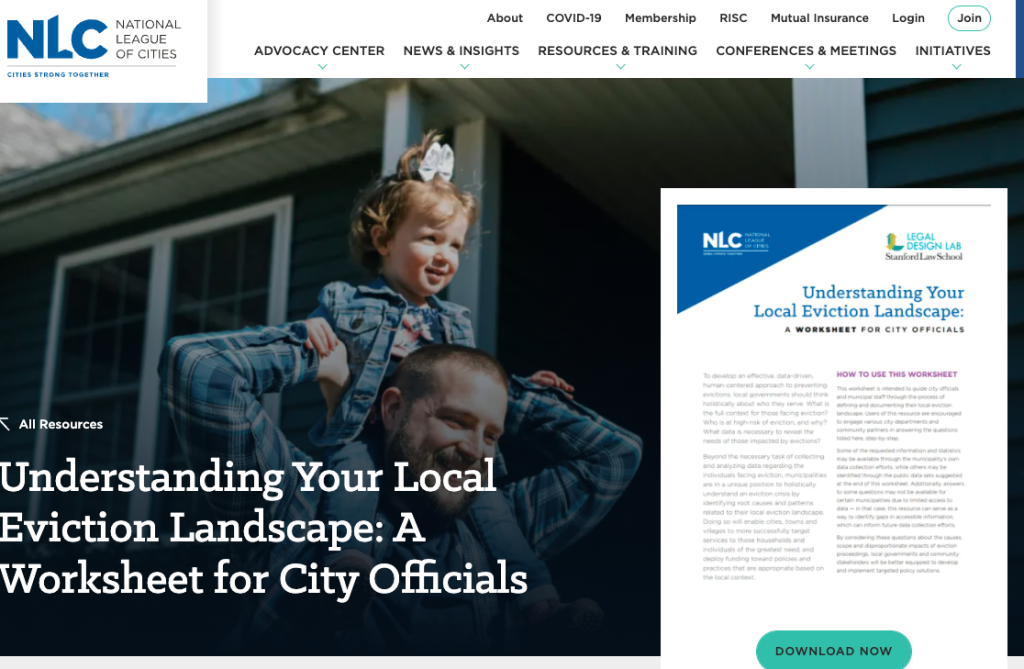
City officials (and others interested in eviction prevention) can use the worksheet to form an analysis & strategy plan around:
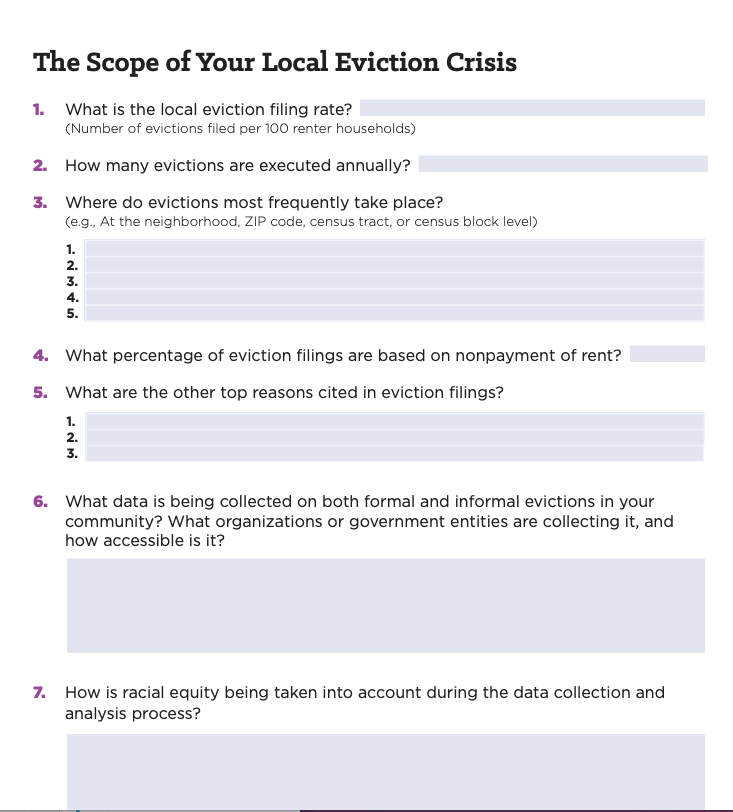
- The scope of their local eviction crisis in terms of the local filing rate, executed evictions and reasons for eviction filings
- The dynamics of the local landlord community
- The demographics and risk factors of tenants facing evictions
- The economic and housing market factors underlying evictions
- The impact of the local housing policy and court processes
- Addressing racial inequities in current eviction systems
- Existing eviction prevention efforts and the involvement of community partners
It offers a structure to follow, and data sources to use to do this analysis & make a profile of what is happening with eviction locally.